Market Outlook
September 21, 2016
Market Cues
Domestic Indices
Chg (%)
(Pts)
(Close)
Indian markets are likely to open on a flat note considering global cues.
BSE Sensex
(0.4)
(111)
28,523
Nifty
(0.4)
(33)
8,776
US Stocks closed Tuesday's session on a modestly higher note ahead of two closely
Mid Cap
(0.1)
(12)
13,121
watched monetary policy decisions. Investors were reluctant to take significant
Small Cap
(0.3)
(33)
12,798
positions ahead of monetary policy decisions by both the Bank of Japan and the
U.S. Federal Reserve. The Biotech Index was the major gainer for the session,
Bankex
(0.3)
(71)
22,739
posting a gain of 1.4%.
Global Indices
Chg (%)
(Pts)
(Close)
UK indices closed the session mildly positive continuing its gains from the previous
session. in the previous session. The index was supported by strong gains from
Dow Jones
0.1
10
18,130
specific stocks. Gaming company GVC Holdings which climbed 4% after a strong
Nasdaq
0.1
6
5,241
first-half result. Shire Plc rallied 2% after it announced that its subsidiary, Shire
FTSE
0.3
17
6,831
Acquisitions Investments Ireland Designated Activity Company, had priced its
Nikkei
(0.2)
(27)
16,492
inaugural public offering at $12.1 bn.
Hang Seng
(0.1)
(20)
23,531
Indian markets closed lower on Tuesday breaking a four day winning streak, on
Shanghai Com
(0.1)
(3)
3,023
profit booking ahead of the FOMC meeting. Most sectoral indices closed lower for
the session. The metal index continued its rally from the previous session and closed
Advances / Declines
BSE
NSE
up 0.38%.
Advances
1,179
614
News Analysis
Declines
1,549
996
Motherson Sumi plans acquisition and capex of `2,000cr
Unchanged
204
80
CCI approves JSW Energy’s purchase of 500 MW plant
Detailed analysis on Pg2
Volumes (` Cr)
Investor’s Ready Reckoner
BSE
3,616
Key Domestic & Global Indicators
NSE
19,204
Stock Watch: Latest investment recommendations on 150+ stocks
Refer Pg5 onwards
Net Inflows (` Cr)
Net
Mtd
Ytd
Top Picks
FII
964
2,705
43,373
CMP
Target
Upside
Company
Sector
Rating
MFs
(172)
(612)
9,497
(`)
(`)
(%)
Amara Raja Batteries Auto & Auto Ancillary
Buy
993
1,174
18.2
HCL Tech
IT
Buy
792
1,000
26.2
Top Gainers
Price (`)
Chg (%)
Bharat Electronics
Capital Goods
Accumulate
1,238
1,414
14.2
Castrolind
460
8.8
Equitas Holdings
Financials
Buy
176
235
33.2
Carerating
1,244
7.8
Navkar Corporation Others
Buy
196
265
35.5
Deltacorp
168
6.8
More Top Picks on Pg3
Marksans
50
6.6
Key Upcoming Events
Escorts
367
5.3
Previous
Consensus
Date
Region
Event Description
Reading
Expectations
Sep 21 US
Initial Jobless claims
260.00
261.00
Top Losers
Price (`)
Chg (%)
Sep 22 US
FOMC rate decision
0.50
0.50
Jublfood
944
(6.1)
Sep 22 Euro Zone
Euro-Zone Consumer Confidence
(8.50)
(8.20)
Ibrealest
87
(5.7)
Sep 22 Germany
PMI Manufacturing
53.60
53.10
Il&Fstrans
101
(5.3)
Sep 23 US
Existing home sales
5.39
5.45
Hdil
84
(5.1)
Sep 23 Germany
PMI Services
51.70
52.20
Sep 26 US
New home sales
Sadbhav
286
(3.4)
654.00
580.00
As on September 20, 2016
Sep 27 US
Consumer Confidence
101.10
98.50
6.(
More Events on Pg4
Market Outlook
September 21, 2016
News Analysis
IOCL, GAIL to take 49% stake in Adani Group LNG project
Indian Oil Corporation (IOC) and gas utility GAIL India Ltd will sign a pact to take
49 per cent stake in Adani Group's
`5,000cr Dhamra LNG project in
Odisha. While IOC will take 38 per cent, GAIL will pick 11 per cent stake in the
proposed 5-million tonne a year liquefied natural gas (LNG) import terminal at
Dhamra by 2018-19.
Adani Petroleum Terminal Pvt will hold 49 per cent in Dhamra LNG Terminal Pvt
Ltd - the firm setting up the LNG plant. The remaining 2 per cent interest will be
held by financial institutions. Dhamra will be the sixth LNG project announced on
the east coast.
Team Lease acquires rival staffing firm NichePro technologies for
`29cr
Team Lease Services expanded its focus on the higher margin IT staffing business
by acquiring local rival NichePro Technologies for `29cr. The acquisition is the
company’s second this year. This acquisition would help the company to get into
the niche business of IT staffing for product companies. This strategy is in line with
the company’s recent acquisition of ASAP Info Systems, which it had acquired for
`67cr in July.
NichePro, which helps place well qualified engineers in multinational and niche
product companies, and had reported revenues of
`26cr with a margin of
`6.8cr. Team Lease plans to fund this acquisition through internal resources.
NichePro employed 30 people and had over 150 associates to recruit staff for its
clients.
Economic and Political News
Centre announces new list of 27 new smart cities- list includes cities such as
Thane, Varanasi, Vadodara, Agra, Nagpur, Ajmer, Amritsar, Gwalior
BRICS agriculture ministers to meet at summit hosted by Ministry of Agriculture
and Farmers Welfare
Cabinet to consider Budget Presentation on Feb 1
Centre procures 3,273 tonnes of Moong directly from farmers at MSP of
`4,800 per quintal plus bonus rate of `425
Corporate News
Carborundum Universal looks to expand its US presence
CBI raids Financial Technologies headquarters in connection with the
investigation into the granting of license to MCX-SX
Gitanjali Gems announces plans to double its retail footprint to 10,000 stores
in India and overseas in the next two years
Bayer launches open offer to buy upto 26% in Monsanto India at a price of
`2,481.60
Market Outlook
September 21, 2016
Top Picks ★★★★★
Large Cap
Market Cap
CMP
Target
Upside
Company
Rationale
(` Cr)
(`)
(`)
(%)
To outpace battery industry growth due to better technological
Amara Raja Batteries
16,962
993
1,174
18.2
products leading to market share gains in both the
automotive OEM and replacement segments.
Uptick in defense capex by government when coupled with
Bharat Electronics
29,711
1,238
1,414
14.2
BELs strong market positioning, indicate that good times are
ahead for BEL.
The stock is trading at attractive valuations and is factoring all
HCL Tech
1,11,760
792
1,000
26.2
the bad news.
Back on the growth trend, expect a long term growth of 14%
Infosys
2,41,260
1,050
1,370
30.4
to be a US$20bn in FY2020.
Source: Company, Angel Research
Mid Cap
Market Cap
CMP
Target
Upside
Company
Rationale
(` Cr)
(`)
(`)
(%)
Among the top 4 players in the consumer durables segment.
Bajaj Electricals
2,719
269
306
13.8
Improved profitability backed by turn around in E&P
segment. Strong order book lends earnings visibility.
Favourable outlook for the AC industry to augur well for
Cooling products business which is out pacing the market
Blue Star
5,011
526
578
9.9
growth. EMPPAC division's profitability to improve once
operating environment turns around.
With a focus on the low and medium income (LMI) consumer
Dewan Housing Finance
8,240
282
325
15.1
segment, the company has increased its presence in tier-II &
III cities where the growth opportunity is immense.
Strong loan growth backed by diversified loan portfolio and
adequate CAR. ROE & ROA likely to remain decent as risk of
Equitas Holdings
5,918
176
235
33.2
dilution remains low. Attractive valuations considering
growth.
Expectations of above average monsoon augurs well for
Goodyear India
1,445
626
684
9.2
Goodyear India as it derives ~50% of its turnover from farm
tyre segment.
Economic recovery to have favourable impact on advertising
& circulation revenue growth. Further, the acquisition of a
Jagran Prakashan
6,139
188
225
19.8
radio business (Radio City) would also boost the company's
revenue growth.
Speedier execution and speedier sales, strong revenue
Mahindra Lifespace
1,850
451
522
15.8
visibilty in short-to-long run, attractive valuations
Massive capacity expansion along with rail advantage at ICD
Navkar Corporation
2,789
196
265
35.5
as well CFS augurs well for the company
Earnings boost on back of stable material prices and
Radico Khaitan
1,384
104
125
20.1
favourable pricing environment. Valuation discount to peers
provides additional comfort
Strong brands and distribution network would boost growth
Siyaram Silk Mills
1,147
1,224
1,469
20.1
going ahead. Stock currently trades at an inexpensive
valuation.
Market leadership in Hindi news genre and no. 2 viewership
ranking in English news genre, exit from the radio business,
TV Today Network
1,899
318
363
14.0
and anticipated growth in ad spends by corporates to benefit
the stock.
Source: Company, Angel Research
Market Outlook
September 21, 2016
Key Upcoming Events
Global economic events release calendar
Bloomberg Data
Date
Time
Country
Event Description
Unit
Period
Last Reported
Estimated
Sep 21, 2016
6:00 PM
US
Initial Jobless claims
Thousands
Sep 17
260.00
261.00
Sep 22, 2016
11:30 PM
US
FOMC rate decision
%
Sep 21
0.50
0.50
7:30 PM Euro Zone Euro-Zone Consumer Confidence
Value Sep A
(8.50)
(8.20)
1:00 PM
Germany
PMI Manufacturing
Value Sep P
53.60
53.10
Sep 23, 2016
7:30 PM
US
Existing home sales
Million
Aug
5.39
5.45
1:00 PM
Germany
PMI Services
Value Sep P
51.70
52.10
Sep 26, 2016
7:30 PM
US
New home sales
Thousands
Aug
654.00
580.00
Sep 27, 2016
7:30 PM
US
Consumer ConfidenceS.A./ 1985=100
Sep
101.10
98.50
Sep 29, 2016
1:25 PM
Germany Unemployment change (000's)
Thousands
Sep
(7.00)
6:00 PM
US
GDP Qoq (Annualised)
% Change 2Q T
1.10
1.60
Sep 30, 2016
2:00 PM
UK
GDP (YoY)
% Change 2Q F
2.20
Oct 01, 2016
6:30 AM
China
PMI Manufacturing
Value
Sep
50.40
Oct 03, 2016
2:00 PM
UK
PMI Manufacturing
Value
Sep
53.30
Oct 04, 2016
11:00 AM
India
RBI Reverse Repo rate
% Oct 4
6.00
11:00 AM
India
RBI Repo rate
% Oct 4
6.50
2:00 PM
UK
Industrial Production (YoY)
% Change
Aug
2.10
Oct 07, 2016
11:00 AM
India
RBI Cash Reserve ratio
% Oct 4
4.00
6:00 PM
US
Change in Nonfarm payrolls
Thousands
Sep
151.00
173.00
6:00 PM
US
Unnemployment rate
% Sep
4.90
4.90
Oct 10, 2016
India
Imports YoY%
% Change
Sep
(14.09)
India
Exports YoY%
% Change
Sep
(0.30)
Source: Bloomberg, Angel Research
Market Outlook
September 21, 2016
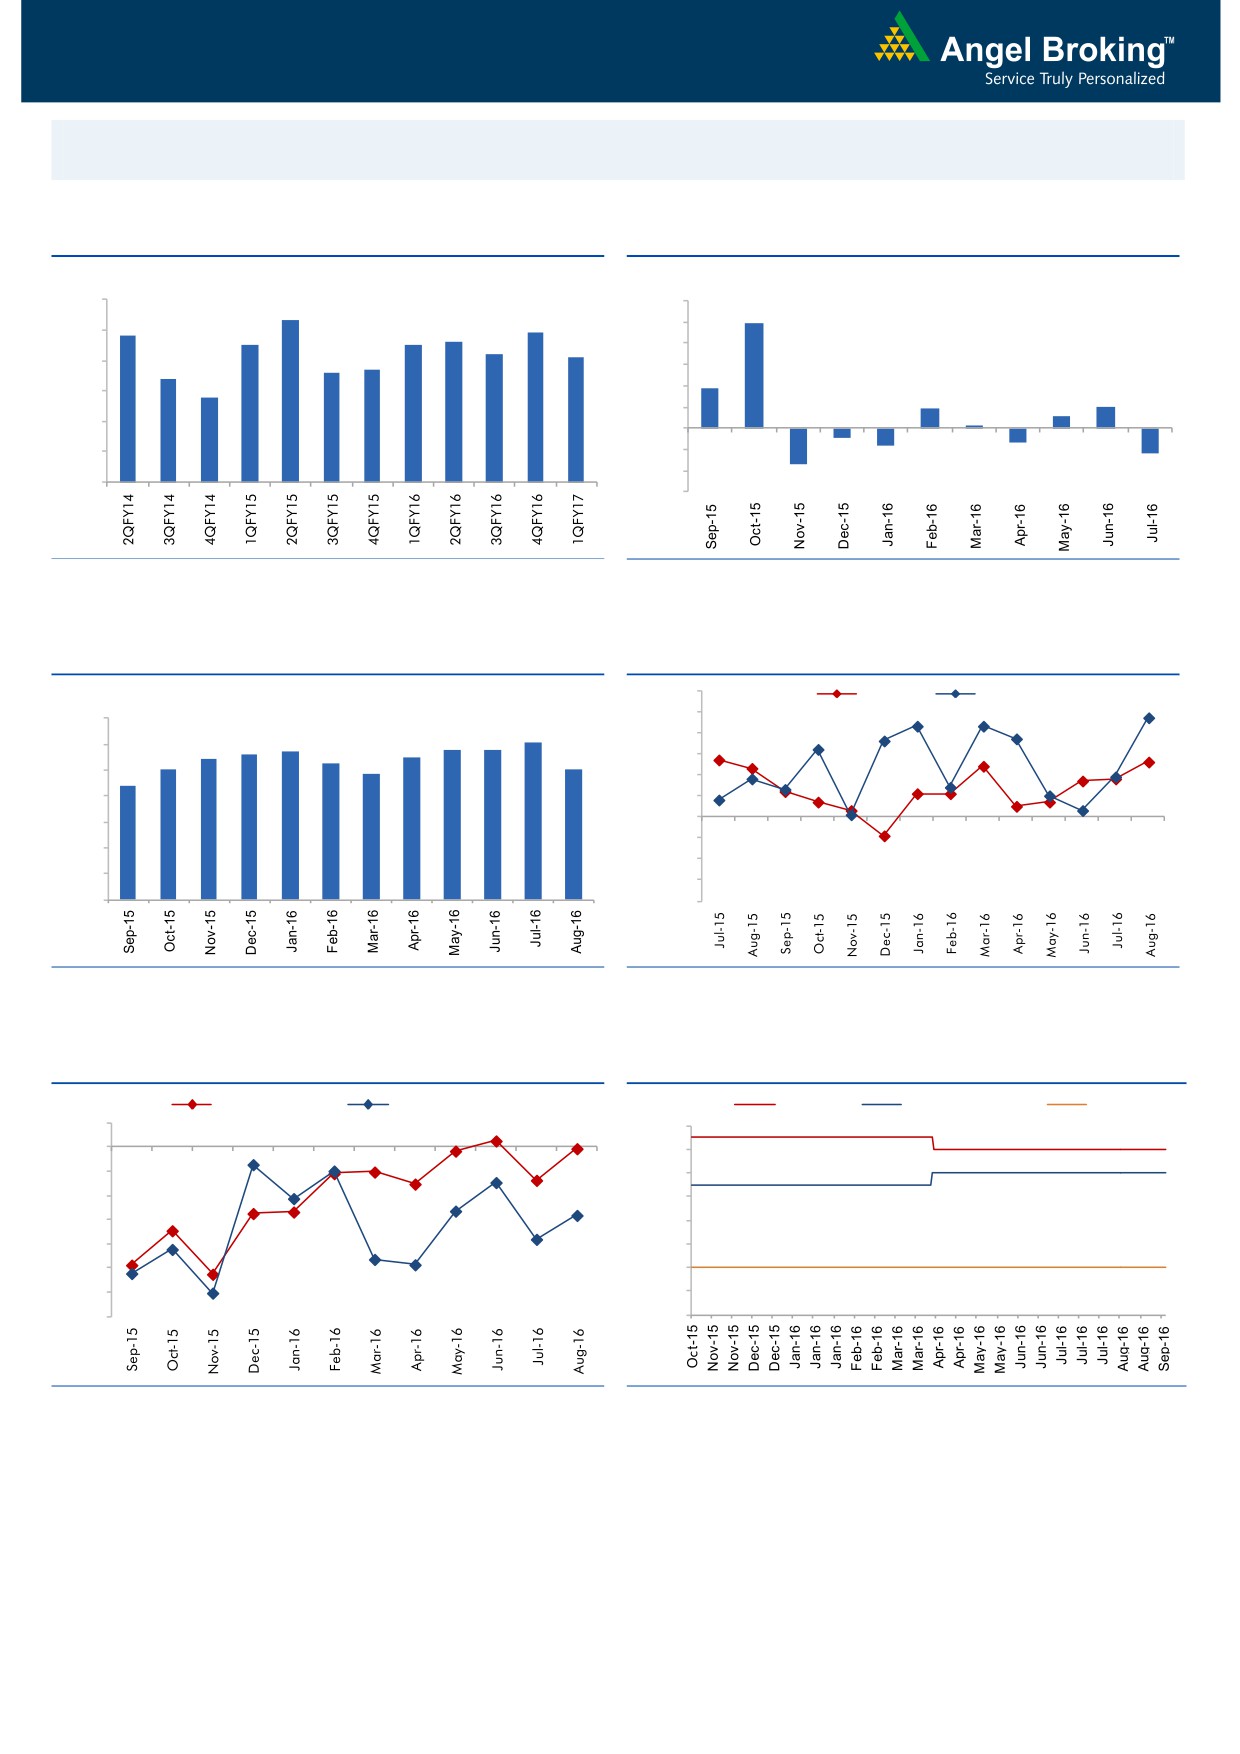
Macro watch
Exhibit 1: Quarterly GDP trends
Exhibit 2: IIP trends
(%)
(%)
9.0
12.0
8.3
9.9
7.8
7.9
8.0
7.5
7.5
7.6
10.0
7.2
7.1
8.0
6.6
6.7
7.0
6.4
6.0
3.7
5.8
6.0
4.0
1.9
2.0
1.1
2.0
0.3
5.0
-
4.0
(2.0)
(0.9)
(1.3)
(1.6)
(4.0)
(2.4)
3.0
(3.4)
(6.0)
Source: CSO, Angel Research
Source: MOSPI, Angel Research
Exhibit 3: Monthly CPI inflation trends
Exhibit 4: Manufacturing and services PMI
56.0
Mfg. PMI
Services PMI
(%)
55.0
7.0
6.1
5.7
5.8
5.8
54.0
6.0
5.4
5.6
5.5
5.0
5.3
5.1
53.0
4.8
5.0
4.4
52.0
4.0
51.0
50.0
3.0
49.0
2.0
48.0
1.0
47.0
-
46.0
Source: MOSPI, Angel Research
Source: Market, Angel Research; Note: Level above 50 indicates expansion
Exhibit 5: Exports and imports growth trends
Exhibit 6: Key policy rates
(%)
Exports yoy growth
Imports yoy growth
(%)
Repo rate
Reverse Repo rate
CRR
5.0
7.00
0.0
6.50
(5.0)
6.00
(10.0)
5.50
(15.0)
5.00
(20.0)
4.50
(25.0)
4.00
(30.0)
3.50
(35.0)
3.00
Source: Bloomberg, Angel Research
Source: RBI, Angel Research
Market Outlook
September 21, 2016
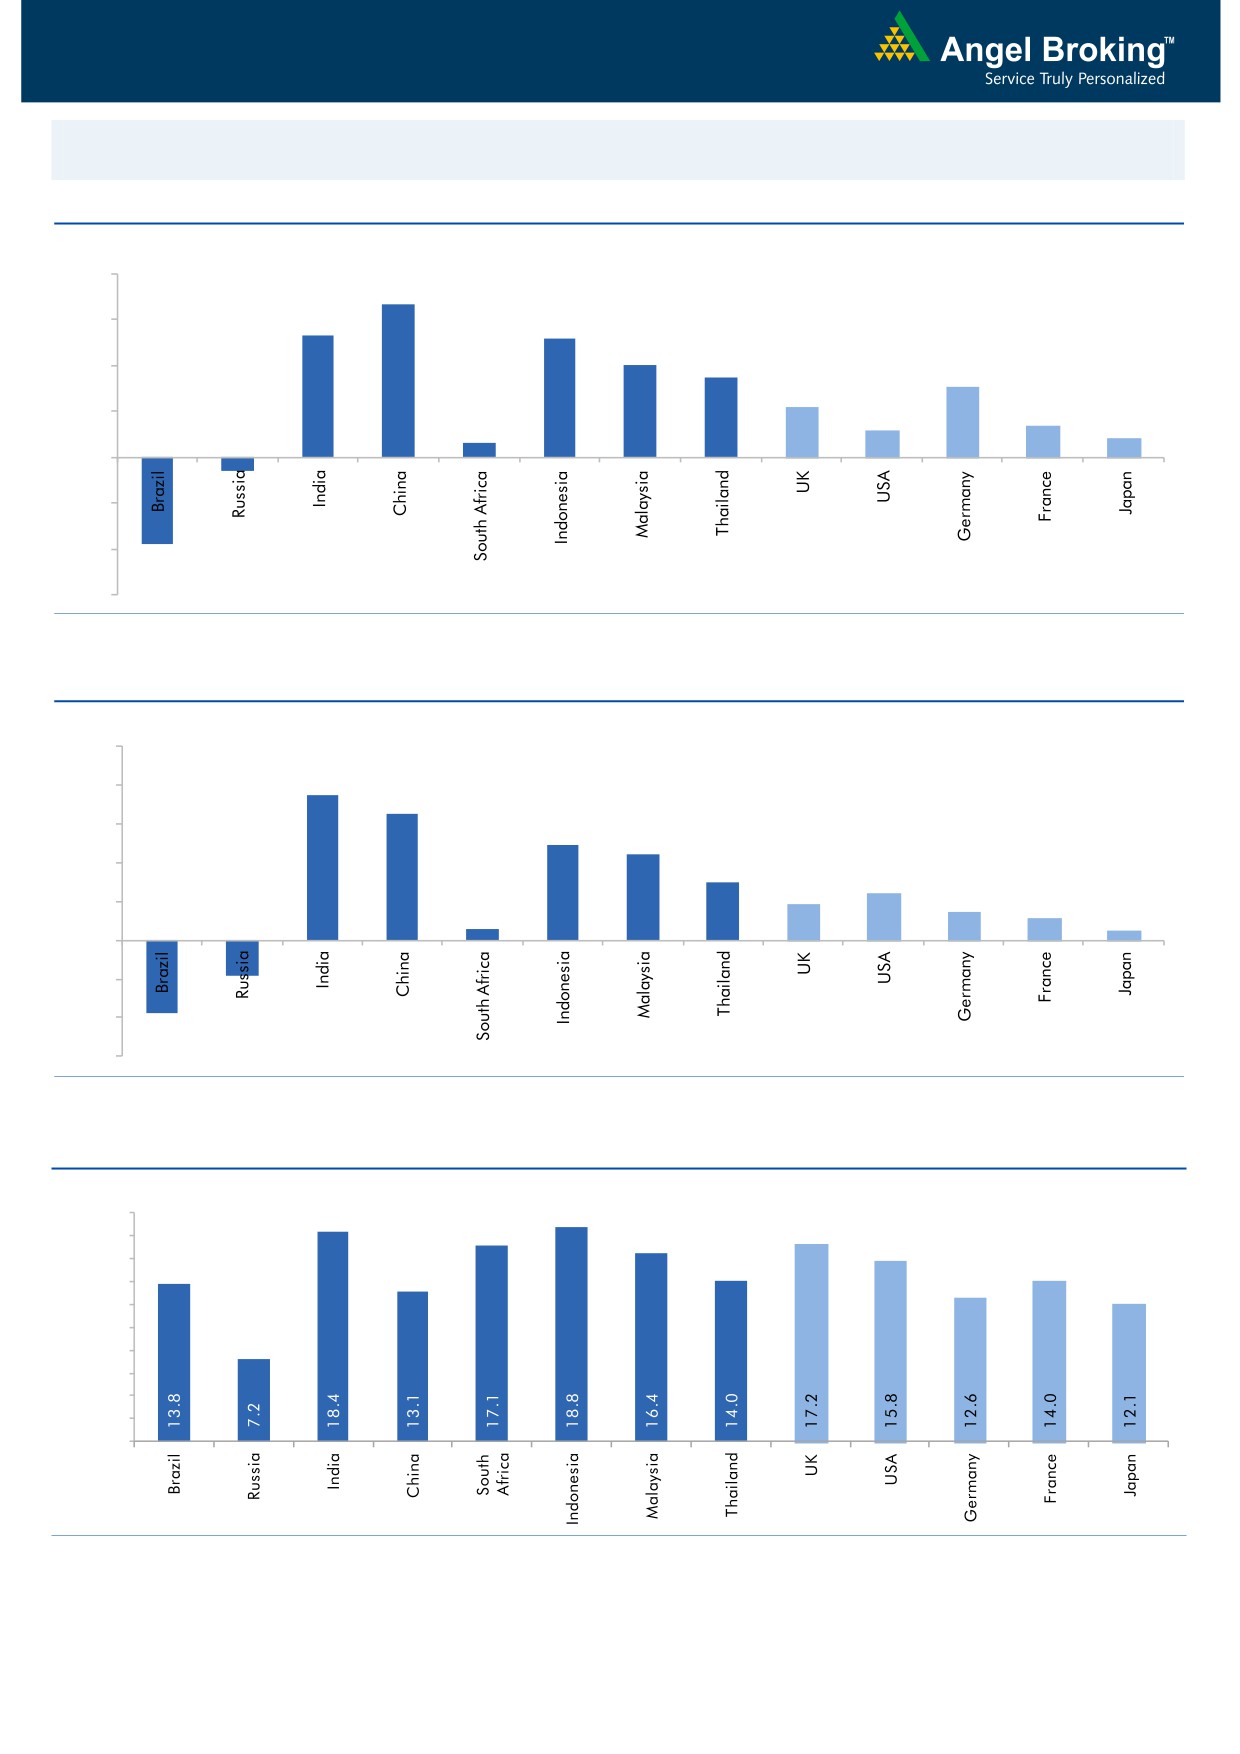
Global watch
Exhibit 1: Latest quarterly GDP Growth (%, yoy) across select developing and developed countries
(%)
8.0
6.7
6.0
5.3
0.6
5.2
4.0
3.5
4.0
3.1
2.2
1.4
2.0
1.2
0.8
-
(2.0)
(0.6)
(4.0)
(3.8)
(6.0)
Source: Bloomberg, Angel Research
Exhibit 2: 2016 GDP Growth projection by IMF (%, yoy) across select developing and developed countries
(%)
10.0
7.5
8.0
6.5
6.0
4.9
4.4
4.0
3.0
2.4
1.9
1.5
2.0
1.1
0.6
0.5
(3.8)
(1.8)
-
(2.0)
(4.0)
(6.0)
Source: IMF, Angel Research
Exhibit 3: One year forward P-E ratio across select developing and developed countries
(x)
20.0
18.0
16.0
14.0
12.0
10.0
8.0
6.0
4.0
2.0
-
Source: IMF, Angel Research
Market Outlook
September 21, 2016
Exhibit 4: Relative performance of indices across globe
Returns (%)
Country
Name of index
Closing price
1M
3M
1YR
Brazil
Bovespa
57,736
(2.4)
13.6
21.9
Russia
Micex
1,992
1.6
5.0
16.4
India
Nifty
8,776
1.8
7.8
12.2
China
Shanghai Composite
3,023
(2.7)
4.9
(5.7)
South Africa
Top 40
44,865
(2.2)
(4.6)
(2.8)
Mexico
Mexbol
46,341
(4.3)
1.4
7.2
Indonesia
LQ45
916
(1.9)
11.1
24.8
Malaysia
KLCI
1,656
(2.6)
1.8
3.3
Thailand
SET 50
939
(4.3)
5.1
3.2
USA
Dow Jones
18,130
(2.5)
1.8
11.0
UK
FTSE
6,831
(0.6)
9.7
13.2
Japan
Nikkei
16,492
0.0
5.7
(5.4)
Germany
DAX
10,394
(1.4)
3.2
10.2
France
CAC
4,389
(0.3)
0.2
1.0
Source: Bloomberg, Angel Research
Stock Watch
September 21, 2016
Company Name
Reco
CMP
Target
Mkt Cap
Sales ( Čcr )
OPM(%)
EPS (Č)
PER(x)
P/BV(x)
RoE(%)
EV/Sales(x)
(Č)
Price ( Č)
( Č cr )
FY17E FY18E
FY17E
FY18E
FY17E
FY18E
FY17E
FY18E
FY17E
FY18E
FY17E
FY18E
FY17E
FY18E
Agri / Agri Chemical
Rallis
Neutral
222
-
4,322
1,937
2,164
13.3
14.3
9.0
11.0
24.7
20.2
4.3
3.8
18.4
19.8
2.2
2.0
United Phosphorus
Neutral
680
-
34,470
15,176
17,604
18.5
18.5
37.4
44.6
18.2
15.3
3.6
3.0
21.4
21.2
2.4
2.0
Auto & Auto Ancillary
Ashok Leyland
Buy
84
111
23,905
22,407
26,022
10.6
10.6
5.2
6.4
16.1
13.1
3.6
3.1
23.6
24.7
1.2
1.0
Bajaj Auto
Neutral
2,888
-
83,572
25,093
27,891
19.5
19.2
143.9
162.5
20.1
17.8
5.6
4.8
30.3
29.4
3.1
2.7
Bharat Forge
Neutral
892
-
20,776
7,726
8,713
20.5
21.2
35.3
42.7
25.3
20.9
4.7
4.2
18.9
20.1
2.8
2.4
Eicher Motors
Neutral
23,428
-
63,633
16,583
20,447
17.5
18.0
598.0
745.2
39.2
31.4
13.4
10.2
41.2
38.3
3.6
2.9
Gabriel India
Neutral
120
-
1,722
1,544
1,715
9.0
9.3
5.4
6.3
22.2
19.0
4.2
3.7
18.9
19.5
1.1
0.9
Hero Motocorp
Neutral
3,468
-
69,254
31,253
35,198
15.3
15.0
172.3
192.1
20.1
18.1
7.4
6.3
38.9
37.0
2.1
1.9
Jamna Auto Industries Neutral
224
-
1,789
1,486
1,620
9.8
9.9
15.0
17.2
14.9
13.0
3.3
2.8
21.8
21.3
1.3
1.2
L G Balakrishnan & Bros Neutral
570
-
895
1,302
1,432
11.6
11.9
43.7
53.0
13.1
10.8
1.8
1.7
13.8
14.2
0.8
0.7
Mahindra and Mahindra Neutral
1,410
-
87,559
46,534
53,077
11.6
11.7
67.3
78.1
20.9
18.1
3.4
3.0
15.4
15.8
1.9
1.6
Maruti
Neutral
5,513
-
166,532
69,186
82,217
14.7
14.4
198.5
241.4
27.8
22.8
5.4
4.4
20.2
20.0
2.1
1.7
Minda Industries
Neutral
300
-
2,379
2,728
3,042
9.0
9.1
68.2
86.2
4.4
3.5
1.0
0.8
23.8
24.3
0.9
0.8
Motherson Sumi
Neutral
322
-
42,639
45,896
53,687
7.8
8.3
13.0
16.1
24.7
20.0
8.0
6.4
34.7
35.4
1.0
0.8
Rane Brake Lining
Neutral
1,234
-
977
511
562
11.3
11.5
28.1
30.9
43.9
39.9
6.7
6.1
15.3
15.0
2.1
1.9
Setco Automotive
Neutral
44
-
584
741
837
13.0
13.0
15.2
17.0
2.9
2.6
0.5
0.4
15.8
16.3
1.2
1.1
Tata Motors
Neutral
548
-
158,103
300,209
338,549
8.9
8.4
42.7
54.3
12.8
10.1
2.1
1.7
15.6
17.2
0.6
0.6
TVS Motor
Neutral
333
-
15,816
13,390
15,948
6.9
7.1
12.8
16.5
26.1
20.1
6.5
5.1
26.3
27.2
1.2
1.0
Amara Raja Batteries
Buy
993
1,174
16,962
5,429
6,471
17.5
17.6
35.3
43.5
28.1
22.8
6.5
5.2
25.3
24.8
3.0
2.5
Exide Industries
Neutral
195
-
16,579
7,439
8,307
15.0
15.0
8.1
9.3
24.1
21.0
3.4
3.0
14.3
16.7
1.8
1.6
Apollo Tyres
Neutral
218
-
11,071
12,877
14,504
14.3
13.9
21.4
23.0
10.2
9.5
1.6
1.4
16.4
15.2
1.0
1.0
Ceat
Neutral
1,136
-
4,596
7,524
8,624
13.0
12.7
131.1
144.3
8.7
7.9
1.6
1.4
19.8
18.6
0.7
0.6
JK Tyres
Neutral
146
-
3,314
7,455
8,056
15.0
15.0
21.8
24.5
6.7
6.0
1.4
1.1
22.8
21.3
0.6
0.5
Swaraj Engines
Neutral
1,212
-
1,505
660
810
15.2
16.4
54.5
72.8
22.2
16.7
6.9
6.3
31.5
39.2
2.1
1.7
Subros
Neutral
135
-
809
1,488
1,681
11.7
11.9
6.4
7.2
21.1
18.8
2.2
2.0
10.8
11.4
0.8
0.7
Indag Rubber
Neutral
178
-
467
286
326
19.8
16.8
11.7
13.3
15.2
13.4
2.6
2.4
17.8
17.1
1.3
1.1
Capital Goods
ACE
Neutral
43
-
429
709
814
4.1
4.6
1.4
2.1
31.0
20.7
1.3
1.2
4.4
6.0
0.8
0.7
BEML
Buy
904
1,157
3,766
3,451
4,055
6.3
9.2
31.4
57.9
28.8
15.6
1.7
1.6
6.3
10.9
1.2
1.0
Bharat Electronics
Accumulate
1,238
1,414
29,711
8,137
9,169
16.8
17.2
58.7
62.5
21.1
19.8
3.3
2.9
44.6
46.3
2.6
2.4
Stock Watch
September 21, 2016
Company Name
Reco
CMP
Target
Mkt Cap
Sales ( Čcr )
OPM(%)
EPS (Č)
PER(x)
P/BV(x)
RoE(%)
EV/Sales(x)
(Č)
Price ( Č)
( Č cr )
FY17E
FY18E
FY17E
FY18E
FY17E
FY18E
FY17E
FY18E
FY17E
FY18E
FY17E
FY18E
FY17E
FY18E
Capital Goods
Voltas
Neutral
383
-
12,663
6,511
7,514
7.9
8.7
12.9
16.3
29.7
23.5
5.3
4.7
16.7
18.5
1.7
1.5
BGR Energy
Neutral
115
-
830
16,567
33,848
6.0
5.6
7.8
5.9
14.7
19.5
0.8
0.8
4.7
4.2
0.2
0.1
BHEL
Neutral
146
-
35,674
28,797
34,742
-
2.8
2.3
6.9
63.4
21.1
1.1
1.0
1.3
4.8
0.9
0.6
Blue Star
Accumulate
526
578
5,011
4,351
5,024
6.4
7.1
17.2
20.6
30.6
25.5
19.9
16.6
23.1
24.1
1.2
1.0
Crompton Greaves
Neutral
81
-
5,092
5,777
6,120
5.9
7.0
3.3
4.5
24.6
18.1
1.1
1.0
4.4
5.9
0.8
0.7
Greaves Cotton
Neutral
133
-
3,238
1,755
1,881
16.8
16.9
7.8
8.5
17.0
15.6
3.4
3.2
20.6
20.9
1.5
1.4
Inox Wind
Buy
202
286
4,479
5,605
6,267
15.7
16.4
24.8
30.0
8.1
6.7
2.3
1.7
25.9
24.4
0.8
0.7
KEC International
Neutral
125
-
3,202
9,294
10,186
7.9
8.1
9.9
11.9
12.6
10.5
1.8
1.6
15.6
16.3
0.6
0.5
Thermax
Neutral
878
-
10,458
5,421
5,940
7.3
7.3
25.7
30.2
34.2
29.1
4.1
3.8
12.2
13.1
1.8
1.7
VATech Wabag
Buy
550
681
2,999
3,136
3,845
8.9
9.1
26.0
35.9
21.2
15.3
2.7
2.3
13.4
15.9
0.9
0.7
Cement
ACC
Neutral
1,635
-
30,711
11,225
13,172
13.2
16.9
44.5
75.5
36.8
21.7
3.5
3.2
11.2
14.2
2.8
2.4
Ambuja Cements
Neutral
267
-
52,957
9,350
10,979
18.2
22.5
5.8
9.5
46.0
28.1
3.9
3.5
10.2
12.5
5.7
4.8
India Cements
Neutral
150
-
4,605
4,364
4,997
18.5
19.2
7.9
11.3
19.0
13.3
1.4
1.3
8.0
8.5
1.8
1.6
JK Cement
Neutral
798
-
5,583
4,398
5,173
15.5
17.5
31.2
55.5
25.6
14.4
3.1
2.7
12.0
15.5
1.8
1.5
J K Lakshmi Cement
Neutral
465
-
5,471
2,913
3,412
14.5
19.5
7.5
22.5
62.0
20.7
3.8
3.2
12.5
18.0
2.5
2.1
Orient Cement
Neutral
196
-
4,016
2,114
2,558
18.5
20.5
8.1
11.3
24.2
17.4
3.6
3.0
9.0
14.0
2.6
2.0
UltraTech Cement
Neutral
3,984
-
109,337
25,768
30,385
21.0
23.5
111.0
160.0
35.9
24.9
4.6
4.0
13.5
15.8
4.3
3.6
Construction
ITNL
Neutral
101
-
3,324
8,946
10,017
31.0
31.6
8.1
9.1
12.5
11.1
0.5
0.5
4.2
5.0
3.7
3.5
KNR Constructions
Accumulate
705
802
1,981
1,385
1,673
14.7
14.0
41.2
48.5
17.1
14.5
3.2
2.8
14.9
15.2
1.5
1.2
Larsen & Toubro
Accumulate
1,475
1,700
137,471
67,665
77,249
10.7
11.5
57.3
71.2
25.7
20.7
2.4
2.2
12.6
14.3
2.2
1.9
Gujarat Pipavav Port
Neutral
173
-
8,368
705
788
52.2
51.7
5.0
5.6
34.6
30.9
3.4
3.1
11.2
11.2
11.8
10.1
Nagarjuna Const.
Neutral
87
-
4,853
8,842
9,775
9.1
8.8
5.3
6.4
16.5
13.6
1.3
1.2
8.2
9.1
0.7
0.6
PNC Infratech
Buy
121
143
3,116
2,350
2,904
13.1
13.2
9.0
8.8
13.5
13.8
0.5
0.4
15.9
13.9
1.5
1.2
Simplex Infra
Neutral
328
-
1,622
6,829
7,954
10.5
10.5
31.4
37.4
10.4
8.8
1.1
1.0
9.9
13.4
0.7
0.6
Power Mech Projects
Neutral
488
-
718
1,801
2,219
12.7
14.6
72.1
113.9
6.8
4.3
1.2
1.1
16.8
11.9
0.4
0.3
Sadbhav Engineering
Neutral
288
-
4,944
3,598
4,140
10.3
10.6
9.0
11.9
32.0
24.2
3.4
2.9
9.9
11.9
1.7
1.4
NBCC
Neutral
253
-
15,186
7,428
9,549
7.9
8.6
8.2
11.0
30.9
23.0
1.5
1.2
28.2
28.7
1.8
1.3
MEP Infra
Neutral
44
-
714
1,877
1,943
30.6
29.8
3.0
4.2
14.7
10.5
7.1
4.8
0.6
0.6
1.8
1.6
SIPL
Neutral
104
-
3,663
1,036
1,252
65.5
66.2
(8.4)
(5.6)
3.9
4.4
(22.8)
(15.9)
11.8
9.8
Stock Watch
September 21, 2016
Company Name
Reco
CMP
Target
Mkt Cap
Sales ( Čcr )
OPM(%)
EPS (Č)
PER(x)
P/BV(x)
RoE(%)
EV/Sales(x)
(Č)
Price ( Č)
( Č cr )
FY17E
FY18E
FY17E
FY18E
FY17E
FY18E
FY17E
FY18E
FY17E
FY18E
FY17E
FY18E
FY17E
FY18E
Construction
Engineers India
Neutral
262
-
8,819
1,725
1,935
16.0
19.1
11.4
13.9
23.0
18.8
3.2
3.1
13.4
15.3
4.1
3.7
Financials
Axis Bank
Neutral
593
-
141,523
58,081
66,459
3.5
3.5
32.4
44.6
18.3
13.3
2.4
2.1
13.6
16.5
-
-
Bank of Baroda
Neutral
167
-
38,433
19,980
23,178
1.8
1.8
11.5
17.3
14.5
9.6
1.7
1.4
8.3
10.1
-
-
Canara Bank
Neutral
304
-
16,499
15,225
16,836
1.8
1.8
14.5
28.0
21.0
10.9
1.5
1.2
5.8
8.5
-
-
Dewan Housing Finance Accumulate
282
325
8,240
2,225
2,688
2.9
2.9
29.7
34.6
9.5
8.2
1.5
1.3
16.1
16.8
-
-
Equitas Holdings
Buy
176
235
5,918
939
1,281
11.7
11.5
5.8
8.2
30.4
21.5
2.6
2.3
10.9
11.5
-
-
Federal Bank
Neutral
72
-
12,345
9,353
10,623
2.9
2.9
4.4
5.8
16.3
12.4
1.6
1.4
9.5
11.0
-
-
HDFC
Neutral
1,394
-
220,315
11,475
13,450
3.4
3.4
45.3
52.5
30.8
26.5
5.9
5.2
20.2
20.5
-
-
HDFC Bank
Neutral
1,288
-
325,987
46,097
55,433
4.5
4.5
58.4
68.0
22.1
18.9
3.9
3.2
18.8
18.6
-
-
ICICI Bank
Neutral
272
-
158,220
39,029
45,903
3.3
3.3
16.7
16.3
16.3
16.7
2.0
1.8
10.1
12.4
-
-
LIC Housing Finance
Neutral
569
-
28,718
3,712
4,293
2.6
2.5
39.0
46.0
14.6
12.4
2.7
2.3
19.9
20.1
-
-
Punjab Natl.Bank
Neutral
138
-
27,029
23,532
23,595
2.3
2.4
6.8
12.6
20.2
10.9
3.1
2.2
3.3
6.5
-
-
RBL Bank
Accumulate
297
325
10,989
1,783
2,309
2.6
2.6
12.7
16.4
23.4
18.1
2.6
2.3
12.8
13.3
-
-
South Ind.Bank
Neutral
23
-
3,146
6,435
7,578
2.5
2.5
2.7
3.1
8.6
7.5
1.1
0.9
10.1
11.2
-
-
St Bk of India
Neutral
254
-
197,369
88,650
98,335
2.6
2.6
13.5
18.8
18.8
13.5
1.8
1.6
7.0
8.5
-
-
Union Bank
Neutral
142
-
9,727
13,450
14,925
2.3
2.3
25.5
34.5
5.6
4.1
0.8
0.7
7.5
10.2
-
-
Yes Bank
Neutral
1,205
-
50,711
8,978
11,281
3.3
3.4
74.0
90.0
16.3
13.4
3.1
2.6
17.0
17.2
-
-
FMCG
Asian Paints
Neutral
1,167
-
111,914
17,128
18,978
16.8
16.4
19.1
20.7
61.1
56.4
21.3
20.1
34.8
35.5
6.4
5.8
Britannia
Neutral
3,411
-
40,920
9,795
11,040
14.6
14.9
80.3
94.0
42.5
36.3
17.5
13.5
41.2
-
4.0
3.5
Colgate
Neutral
962
-
26,166
4,605
5,149
23.4
23.4
23.8
26.9
40.4
35.8
22.4
17.5
64.8
66.8
5.6
5.0
Dabur India
Neutral
291
-
51,217
8,315
9,405
19.8
20.7
8.1
9.2
35.9
31.7
10.0
8.3
31.6
31.0
5.9
5.2
GlaxoSmith Con*
Neutral
6,162
-
25,913
4,350
4,823
21.2
21.4
179.2
196.5
34.4
31.4
9.1
7.7
27.1
26.8
5.4
4.8
Godrej Consumer
Neutral
1,636
-
55,698
10,235
11,428
18.4
18.6
41.1
44.2
39.8
37.0
8.8
7.5
24.9
24.8
5.6
4.9
HUL
Neutral
903
-
195,464
35,252
38,495
17.6
17.4
20.4
21.9
44.2
41.2
36.4
31.9
82.2
77.3
5.4
5.0
ITC
Accumulate
257
283
310,280
40,059
44,439
39.0
39.2
9.1
10.1
28.3
25.5
7.7
6.8
27.2
26.5
7.3
6.5
Marico
Neutral
291
-
37,596
6,430
7,349
18.8
19.5
6.4
7.7
45.5
37.8
13.8
11.6
33.2
32.5
5.7
4.9
Nestle*
Neutral
6,334
-
61,066
10,073
11,807
20.7
21.5
124.8
154.2
50.8
41.1
20.8
18.7
34.8
36.7
5.9
5.0
Tata Global
Neutral
138
-
8,710
8,675
9,088
9.8
9.8
7.4
8.2
18.7
16.8
2.1
2.0
7.9
8.1
0.9
0.9
Procter & Gamble
Accumulate
6,700
7,369
21,749
2,939
3,342
23.2
23.0
146.2
163.7
45.8
40.9
102.6
98.4
25.3
23.5
7.0
6.1
Hygiene
Stock Watch
September 21, 2016
Company Name
Reco
CMP
Target
Mkt Cap
Sales ( Čcr )
OPM(%)
EPS (Č)
PER(x)
P/BV(x)
RoE(%)
EV/Sales(x)
(Č)
Price ( Č)
( Č cr )
FY17E FY18E
FY17E
FY18E
FY17E
FY18E
FY17E
FY18E
FY17E
FY18E
FY17E
FY18E
FY17E
FY18E
IT
HCL Tech^
Buy
792
1,000
111,760
49,242
57,168
20.5
20.5
55.7
64.1
14.2
12.4
2.9
2.2
20.3
17.9
2.1
1.7
Infosys
Buy
1,050
1,370
241,260
69,934
79,025
27.5
27.5
64.8
72.0
16.2
14.6
3.6
3.3
22.0
22.3
2.9
2.5
TCS
Buy
2,411
3,004
475,090
121,684
136,286
27.3
27.3
135.0
150.1
17.9
16.1
5.9
5.5
33.2
33.9
3.7
3.2
Tech Mahindra
Buy
463
700
44,944
30,347
33,685
17.0
17.0
37.5
41.3
12.4
11.2
2.7
2.3
21.8
20.7
1.2
1.0
Wipro
Buy
480
680
116,724
51,631
55,822
21.7
17.9
35.9
36.9
13.4
13.0
2.8
2.6
19.0
18.1
2.0
1.7
Media
D B Corp
Neutral
397
-
7,292
2,297
2,590
27.4
28.2
21.0
23.4
18.9
17.0
4.4
3.8
23.7
23.1
3.0
2.6
HT Media
Neutral
82
-
1,913
2,693
2,991
12.6
12.9
7.9
9.0
10.4
9.1
0.9
0.8
7.8
8.3
0.3
0.2
Jagran Prakashan
Buy
188
225
6,139
2,355
2,635
28.0
28.0
10.8
12.5
17.4
15.0
3.8
3.3
21.7
21.7
2.6
2.3
Sun TV Network
Neutral
486
-
19,154
2,850
3,265
70.1
71.0
26.2
30.4
18.6
16.0
4.8
4.2
24.3
25.6
6.4
5.4
Hindustan Media
Neutral
284
-
2,084
1,016
1,138
24.3
25.2
27.3
30.1
10.4
9.4
2.0
1.8
16.2
15.8
1.4
1.2
Ventures
TV Today Network
Buy
318
363
1,899
637
743
27.5
27.5
18.4
21.4
17.3
14.9
3.0
2.6
17.4
17.2
2.5
2.1
Metals & Mining
Coal India
Neutral
329
-
208,061
84,638
94,297
21.4
22.3
24.5
27.1
13.4
12.2
5.6
5.3
42.6
46.0
2.0
1.8
Hind. Zinc
Neutral
221
-
93,189
14,252
18,465
55.9
48.3
15.8
21.5
14.0
10.3
2.3
2.0
17.0
20.7
6.4
5.0
Hindalco
Neutral
145
-
30,015
107,899
112,095
7.4
8.2
9.2
13.0
15.8
11.2
0.8
0.7
4.8
6.6
0.8
0.7
JSW Steel
Neutral
1,761
-
42,573
53,201
58,779
16.1
16.2
130.6
153.7
13.5
11.5
1.8
1.6
14.0
14.4
1.6
1.4
NMDC
Neutral
103
-
40,797
6,643
7,284
44.4
47.7
7.1
7.7
14.5
13.4
1.3
1.2
8.8
9.2
3.9
3.5
SAIL
Neutral
48
-
19,721
47,528
53,738
(0.7)
2.1
(1.9)
2.6
18.4
0.5
0.5
(1.6)
3.9
1.3
1.1
Vedanta
Neutral
164
-
48,665
71,744
81,944
19.2
21.7
13.4
20.1
12.3
8.2
1.1
0.9
8.4
11.3
1.1
0.8
Tata Steel
Neutral
365
-
35,493
121,374
121,856
7.2
8.4
18.6
34.3
19.7
10.7
1.2
1.1
6.1
10.1
0.9
0.9
Oil & Gas
Cairn India
Neutral
192
-
36,016
9,127
10,632
4.3
20.6
8.8
11.7
21.8
16.4
0.7
0.7
3.3
4.2
5.4
4.5
GAIL
Neutral
385
-
48,887
56,220
65,198
9.3
10.1
27.1
33.3
14.2
11.6
1.3
1.2
9.3
10.7
1.1
0.9
ONGC
Neutral
258
-
220,518
137,222
152,563
15.0
21.8
19.5
24.1
13.2
10.7
1.1
1.1
8.5
10.1
1.9
1.7
Indian Oil Corp
Neutral
571
-
138,515
373,359
428,656
5.9
5.5
54.0
59.3
10.6
9.6
1.6
1.5
16.0
15.6
0.5
0.4
Reliance Industries
Neutral
1,074
-
348,271
301,963
358,039
12.1
12.6
87.7
101.7
12.3
10.6
1.3
1.1
10.7
11.3
1.6
1.4
Pharmaceuticals
Alembic Pharma
Neutral
652
-
12,288
3,483
4,083
20.2
21.4
24.3
30.4
26.8
21.4
6.1
4.9
25.5
25.3
3.4
2.9
Aurobindo Pharma
Accumulate
805
877
47,127
15,720
18,078
23.7
23.7
41.4
47.3
19.5
17.0
5.1
4.0
29.6
26.1
3.2
2.8
Aventis*
Neutral
4,287
-
9,873
2,357
2,692
17.3
17.3
153.5
169.2
27.9
25.3
4.7
3.8
25.8
28.4
3.9
3.2
Cadila Healthcare
Neutral
393
-
40,238
11,126
13,148
22.0
22.0
17.1
20.0
23.0
19.7
5.9
4.7
28.8
26.6
3.6
2.9
Cipla
Sell
602
490
48,367
15,378
18,089
17.4
18.4
21.6
27.2
27.9
22.1
3.6
3.1
13.7
15.2
3.3
2.8
Stock Watch
September 21, 2016
Company Name
Reco
CMP
Target
Mkt Cap
Sales ( Čcr )
OPM(%)
EPS (Č)
PER(x)
P/BV(x)
RoE(%)
EV/Sales(x)
(Č)
Price ( Č)
( Č cr )
FY17E FY18E
FY17E
FY18E
FY17E
FY18E
FY17E
FY18E
FY17E
FY18E
FY17E
FY18E
FY17E
FY18E
Pharmaceuticals
Dr Reddy's
Neutral
3,159
-
52,339
16,043
18,119
23.1
24.7
126.0
157.8
25.1
20.0
3.7
3.2
15.7
17.1
3.2
2.8
Dishman Pharma
Sell
206
45
3,327
1,718
1,890
22.7
22.8
9.5
11.3
21.7
18.2
2.1
1.9
10.1
10.9
2.3
2.0
GSK Pharma*
Neutral
2,830
-
23,969
3,528
3,811
16.6
18.8
51.8
59.4
54.6
47.6
14.6
14.6
26.3
30.6
6.6
6.1
Indoco Remedies
Sell
329
225
3,036
1,112
1,289
18.2
18.2
13.2
15.6
25.0
21.1
4.4
3.8
19.2
19.2
2.8
2.4
Ipca labs
Neutral
590
-
7,445
3,303
3,799
15.3
15.3
17.3
19.7
34.1
30.0
3.0
2.7
9.1
9.4
2.4
2.1
Lupin
Buy
1,549
1,809
69,824
15,912
18,644
26.4
26.7
58.1
69.3
26.7
22.4
5.2
4.3
21.4
20.9
4.4
3.7
Sun Pharma
Buy
778
944
187,337
31,129
35,258
30.0
30.9
28.0
32.8
27.8
23.7
4.3
3.6
18.7
18.9
5.6
4.8
Power
Tata Power
Neutral
76
-
20,488
36,916
39,557
17.4
27.1
5.1
6.3
14.9
12.0
1.3
1.2
9.0
10.3
1.6
1.4
NTPC
Neutral
153
-
126,527
86,605
95,545
17.5
20.8
11.8
13.4
13.0
11.5
1.3
1.2
10.5
11.1
2.8
2.8
Power Grid
Neutral
178
-
93,096
25,763
29,762
74.3
73.1
14.8
17.3
12.0
10.3
1.9
1.7
16.9
17.5
7.9
7.5
Real Estate
Prestige Estate
Accumulate
202
210
7,581
4,707
5,105
25.2
26.0
10.3
13.0
19.6
15.6
1.6
1.5
10.3
10.2
2.7
2.4
MLIFE
Buy
451
522
1,850
1,152
1,300
22.7
24.6
29.9
35.8
15.1
12.6
1.1
1.1
7.6
8.6
2.3
1.9
Telecom
Bharti Airtel
Neutral
320
-
127,837
105,086
114,808
34.5
34.7
12.2
16.4
26.2
19.5
1.8
1.7
6.8
8.4
2.1
1.9
Idea Cellular
Neutral
84
-
30,193
40,133
43,731
37.2
37.1
6.4
6.5
13.1
12.9
1.1
1.0
8.2
7.6
1.8
1.5
zOthers
Abbott India
Neutral
4,593
-
9,761
3,153
3,583
14.1
14.4
152.2
182.7
30.2
25.1
148.2
126.5
25.6
26.1
2.9
2.5
Bajaj Electricals
Buy
269
306
2,719
5,099
5,805
5.6
5.9
11.4
14.6
23.7
18.5
3.2
2.8
13.4
15.1
0.5
0.5
Finolex Cables
Neutral
439
-
6,716
2,883
3,115
12.0
12.1
14.2
18.6
30.9
23.6
16.5
14.4
15.8
14.6
2.0
1.8
Goodyear India*
Accumulate
626
684
1,445
1,598
1,704
10.4
10.2
49.4
52.6
12.7
11.9
58.5
51.3
18.2
17.0
0.6
82.8
Hitachi
Neutral
1,481
-
4,028
2,081
2,433
8.8
8.9
33.4
39.9
44.4
37.1
35.8
29.8
22.1
21.4
1.9
1.6
Jyothy Laboratories
Neutral
349
-
6,321
1,440
2,052
11.5
13.0
8.5
10.0
41.1
34.9
9.9
9.2
18.6
19.3
4.5
3.1
Page Industries
Neutral
15,067
-
16,805
2,450
3,124
20.1
17.6
299.0
310.0
50.4
48.6
335.6
256.2
47.1
87.5
7.0
5.5
Relaxo Footwears
Neutral
424
-
5,088
2,085
2,469
9.2
8.2
7.6
8.0
56.1
53.3
21.7
18.6
17.9
18.8
2.5
2.1
Siyaram Silk Mills
Buy
1,224
1,469
1,147
1,799
2,040
11.6
11.7
104.9
122.4
11.7
10.0
1.9
1.6
16.4
16.4
0.8
0.7
Styrolution ABS India*
Neutral
595
-
1,047
1,440
1,537
9.2
9.0
40.6
42.6
14.7
14.0
37.4
34.0
12.3
11.6
0.7
0.6
TVS Srichakra
Neutral
2,850
-
2,182
2,304
2,614
13.7
13.8
231.1
266.6
12.3
10.7
320.2
252.2
33.9
29.3
1.0
0.8
HSIL
Neutral
350
-
2,533
2,384
2,515
15.8
16.3
15.3
19.4
22.9
18.1
22.8
19.6
7.8
9.3
1.2
1.1
Kirloskar Engines India
Neutral
313
-
4,526
2,554
2,800
9.9
10.0
10.5
12.1
29.8
25.9
12.5
11.8
10.7
11.7
1.4
1.2
Ltd
M M Forgings
Neutral
423
-
511
546
608
20.4
20.7
41.3
48.7
10.3
8.7
58.0
51.3
16.6
17.0
0.8
0.7
Banco Products (India)
Neutral
219
-
1,567
1,353
1,471
12.3
12.4
14.5
16.3
15.1
13.4
20.9
18.8
14.5
14.6
1.1
118.7
Stock Watch
September 21, 2016
Company Name
Reco
CMP
Target
Mkt Cap
Sales ( Čcr )
OPM(%)
EPS (Č)
PER(x)
P/BV(x)
RoE(%)
EV/Sales(x)
(Č)
Price ( Č)
( Č cr )
FY17E
FY18E
FY17E
FY18E
FY17E
FY18E
FY17E
FY18E
FY17E
FY18E
FY17E
FY18E
FY17E
FY18E
zOthers
Competent Automobiles Neutral
202
-
124
1,137
1,256
3.1
2.7
28.0
23.6
7.2
8.6
38.8
35.1
14.3
11.5
0.1
0.1
Nilkamal
Neutral
1,332
-
1,987
1,995
2,165
10.7
10.4
69.8
80.6
19.1
16.5
76.1
66.1
16.6
16.5
1.0
0.9
Visaka Industries
Neutral
196
-
312
1,051
1,138
10.3
10.4
21.0
23.1
9.3
8.5
25.2
23.6
9.0
9.2
0.6
0.5
Transport Corporation of
Neutral
199
-
1,527
2,671
2,911
8.5
8.8
13.9
15.7
14.4
12.7
2.0
1.8
13.7
13.8
0.7
0.6
India
Elecon Engineering
Neutral
61
-
661
1,482
1,660
13.7
14.5
3.9
5.8
15.6
10.5
3.7
3.4
7.8
10.9
0.8
0.7
Surya Roshni
Neutral
207
-
907
3,342
3,625
7.8
7.5
17.3
19.8
12.0
10.5
22.8
18.3
10.5
10.8
0.5
0.5
MT Educare
Neutral
133
-
531
366
417
17.7
18.2
9.4
10.8
14.2
12.4
3.2
2.8
22.2
22.3
1.4
1.2
Radico Khaitan
Buy
104
125
1,384
1,659
1,802
13.0
13.2
6.3
7.4
16.4
14.1
1.4
1.3
8.6
9.3
1.3
1.2
Garware Wall Ropes
Neutral
508
-
1,112
873
938
12.9
13.1
30.9
34.9
16.4
14.6
2.6
2.2
15.7
15.2
1.2
1.1
Wonderla Holidays
Neutral
385
-
2,175
287
355
38.0
40.0
11.3
14.2
34.1
27.1
4.9
4.3
21.4
23.9
7.3
5.9
Linc Pen & Plastics
Neutral
275
-
407
382
420
9.3
9.5
13.5
15.7
20.4
17.5
3.5
3.0
17.1
17.3
1.1
1.0
The Byke Hospitality
Neutral
161
-
647
287
384
20.5
20.5
7.6
10.7
21.2
15.1
4.4
3.6
20.7
23.5
2.3
1.7
Interglobe Aviation
Neutral
858
-
30,928
21,122
26,005
14.5
27.6
110.7
132.1
7.8
6.5
46.4
33.1
168.5
201.1
1.5
1.1
Coffee Day Enterprises
Neutral
233
-
4,794
2,964
3,260
20.5
21.2
4.7
8.0
-
29.1
2.7
2.5
5.5
8.5
2.0
1.8
Ltd
Navneet Education
Neutral
104
-
2,469
1,062
1,147
24.0
24.0
6.1
6.6
17.0
15.7
3.5
3.1
20.6
19.8
2.4
2.2
Navkar Corporation
Buy
196
265
2,789
408
612
42.9
42.3
6.8
11.5
28.9
17.0
2.0
1.8
6.9
10.5
7.9
5.2
UFO Moviez
Neutral
472
-
1,303
619
685
33.2
33.4
30.0
34.9
15.8
13.5
2.2
1.9
13.8
13.9
1.8
1.5
VRL Logistics
Neutral
292
-
2,665
1,902
2,119
16.7
16.6
14.6
16.8
20.1
17.4
4.4
3.9
21.9
22.2
1.5
1.3
Team Lease Serv.
Neutral
1,121
-
1,917
3,229
4,001
1.5
1.8
22.8
32.8
49.2
34.1
5.3
4.6
10.7
13.4
0.5
0.4
S H Kelkar & Co.
Neutral
308
-
4,454
1,036
1,160
15.1
15.0
6.1
7.2
50.4
42.9
5.4
4.9
10.7
11.5
4.2
3.7
Quick Heal
Neutral
223
-
1,560
408
495
27.3
27.0
7.7
8.8
28.8
25.3
2.7
2.7
9.3
10.6
3.0
2.5
Narayana Hrudaya
Neutral
320
-
6,540
1,873
2,166
11.5
11.7
2.6
4.0
121.0
80.7
7.4
6.7
6.1
8.3
3.6
3.1
Manpasand Bever.
Neutral
702
-
3,515
836
1,087
19.6
19.4
16.9
23.8
41.6
29.5
5.0
4.4
12.0
14.8
4.0
3.0
Parag Milk Foods
Neutral
323
-
2,717
1,919
2,231
9.3
9.6
9.5
12.9
34.2
25.0
5.3
4.4
15.5
17.5
1.6
1.4
Mirza International
Buy
89
113
1,071
1,024
1,148
18.0
18.0
6.9
8.0
12.9
11.1
2.2
1.8
16.6
16.2
1.2
1.1
Source: Company, Angel Research; Note: *December year end; #September year end; &October year end; Price as on September 20, 2016
Market Outlook
September 21, 2016
Research Team Tel: 022 - 39357800
DISCLAIMER
Angel Broking Private Limited (hereinafter referred to as “Angel”) is a registered Member of National Stock Exchange of India
Limited,Bombay Stock Exchange Limited and Metropolitan Stock Exchange Limited. It is also registered as a Depository Participant with
CDSL and Portfolio Manager with SEBI. It also has registration with AMFI as a Mutual Fund Distributor. Angel Broking Private Limited is a
registered entity with SEBI for Research Analyst in terms of SEBI (Research Analyst) Regulations, 2014 vide registration number
INH000000164. Angel or its associates has not been debarred/ suspended by SEBI or any other regulatory authority for accessing
/dealing in securities Market. Angel or its associates/analyst has not received any compensation / managed or
co-managed public offering of securities of the company covered by Analyst during the past twelve months.
This document is solely for the personal information of the recipient, and must not be singularly used as the basis of any investment
decision. Nothing in this document should be construed as investment or financial advice. Each recipient of this document should make
such investigations as they deem necessary to arrive at an independent evaluation of an investment in the securities of the companies
referred to in this document (including the merits and risks involved), and should consult their own advisors to determine the merits and
risks of such an investment.
Reports based on technical and derivative analysis center on studying charts of a stock's price movement, outstanding positions and
trading volume, as opposed to focusing on a company's fundamentals and, as such, may not match with a report on a company's
fundamentals. Investors are advised to refer the Fundamental and Technical Research Reports available on our website to evaluate the
contrary view, if any.
The information in this document has been printed on the basis of publicly available information, internal data and other reliable
sources believed to be true, but we do not represent that it is accurate or complete and it should not be relied on as such, as this
document is for general guidance only. Angel Broking Pvt. Limited or any of its affiliates/ group companies shall not be in any way
responsible for any loss or damage that may arise to any person from any inadvertent error in the information contained in this report.
Angel Broking Pvt. Limited has not independently verified all the information contained within this document. Accordingly, we cannot
testify, nor make any representation or warranty, express or implied, to the accuracy, contents or data contained within this document.
While Angel Broking Pvt. Limited endeavors to update on a reasonable basis the information discussed in this material, there may be
regulatory, compliance, or other reasons that prevent us from doing so.
This document is being supplied to you solely for your information, and its contents, information or data may not be reproduced,
redistributed or passed on, directly or indirectly.
Neither Angel Broking Pvt. Limited, nor its directors, employees or affiliates shall be liable for any loss or damage that may arise from
or in connection with the use of this information.